IES ConcreteSection User's Guide
Interaction Surface
In ConcreteSection, the interaction surface represents the strength of a reinforced concrete section under combined axial and biaxial bending. It is calculated using equilibrium, strain compatibility, and the constitutive models for both concrete and steel, as described in the Analysis section. Because ConcreteSection uses a more refined analysis approach, the resulting capacities may differ from those obtained with common approximate methods, such as the rectangular Whitney stress block. A variety of diagram views are provided to visualize and interpret this data, including slices through the interaction surface and Moment Unity diagrams used for design evaluation.
ConcreteSection provides five tabs for viewing the interaction surface and associated diagrams:
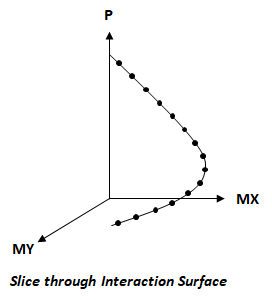
These diagrams illustrate the capacity of the reinforced concrete section, incorporating Strength Reduction when applied. If factored loads are defined, they are displayed as points on the diagrams. The MX and MY views show vertical slices through the interaction surface, while the Flexure and Moment Unity views show horizontal slices. Note: The position of the slices in the MX, MY, and Flexure diagrams can be adjusted using the offset parameter in the .
Given the concrete failure strain, the neutral axis offset, and the neutral axis angle, ConcreteSection calculates a capacity point (Pn, Mnx, Mny) on the interaction surface by using the approach described in the Analysis section.
For a fixed neutral axis angle, ConcreteSection varies the neutral axis offset to compute a series of interaction points—this forms a single “slice” through the interaction surface (as shown in the image below). The number of points in each slice (i.e., the number of offset values) can be set in the section of the . Similarly, the number of slices per quadrant (i.e., different neutral axis angles) can also be configured. All four quadrants of the surface use the same number of slices. The mesh refinement setting controls how finely the section is discretized: higher refinement improves accuracy but increases computation time. By varying the neutral axis angle from 0 to 360 degrees, and for each angle varying the neutral axis offset across the entire section (and beyond), ConcreteSection can generate the full interaction surface for the modeled section. Interaction diagrams can then be obtained by "slicing" a horizontal or vertical plane through this surface.
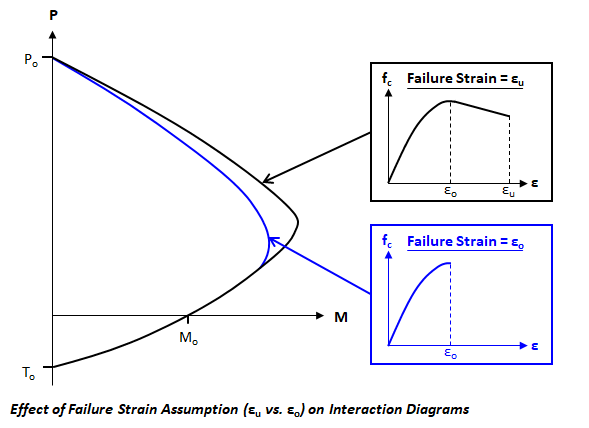
The interaction surface becomes more detailed as the number of interaction points and quadrant slices increases, and becomes more accurate as the mesh refinement is increased. The surface is computed based on the concrete failure strain, which can be set to either εo (strain at maximum stress) or εu (ultimate strain). This setting influences the calculated capacity of the section, as illustrated in the image below. Note: The interaction surface does not account for slenderness effects in concrete columns.
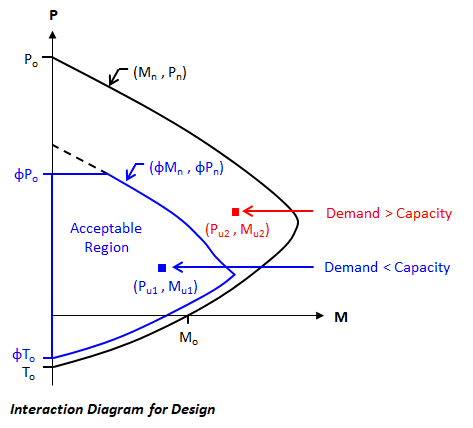
In ConcreteSection, the Strength Reduction parameter and the Transverse Reinforcement type are set in the tab. Choosing a design code (ACI 318, CSA A23.3, or Eurocode 2) applies the appropriate strength reduction factors (known as partial safety factors in Eurocode 2) and limits the maximum axial compressive capacity according to that specification. For ACI and CSA, the maximum axial compressive strength depends on the transverse reinforcement type. For Eurocode 2, it is based on a minimum eccentricity of h/30, but not less than 20 mm.
The image below shows how the interaction diagram (a vertical slice through the interaction surface) is reduced when strength reduction factors are applied. If the applied factored loads lie inside the factored interaction surface (e.g., Pu1, Mu1), the capacity exceeds the demand; conversely, if the loads lie outside the factored interaction surface (e.g., Pu2, Mu2), the demand exceeds the capacity.
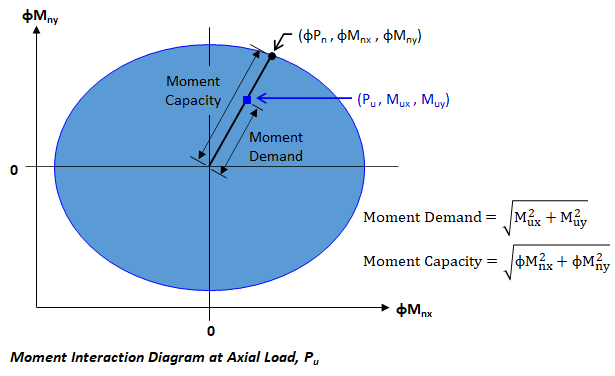
To assist with design checks, ConcreteSection provides Moment Unity values that indicate where the factored loads fall relative to the interaction surface.
The Moment Unity view displays the flexural capacity of the section at the factored axial load for a selected Result Case. It represents a horizontal slice through the interaction surface at the level of the factored axial force. If the applied axial force exceeds the axial-load-only capacity—greater than fPo (compression) or less than fTo (tension)—the Moment Unity diagram cannot be generated. This view is also disabled when no loads are applied to the section.
The Moment Unity view helps visualize how Moment Unity values are calculated. ConcreteBending computes the Moment Unity value for each result case as:
Moment Unity = Moment Demand / Moment Capacity
Where:
Moment Demand is the distance from the center of the diagram to the load point
Moment Capacity is the distance from the center to the edge of the unity diagram along the same radial line
These distances are illustrated in the figure below. Note: If strength reduction factors are not applied, the calculation uses the un-factored interaction surface.